Clustering Burger King Menu with the Dirichlet Process
Posted on August 18 2015 in Machine Learning
an interesting graph
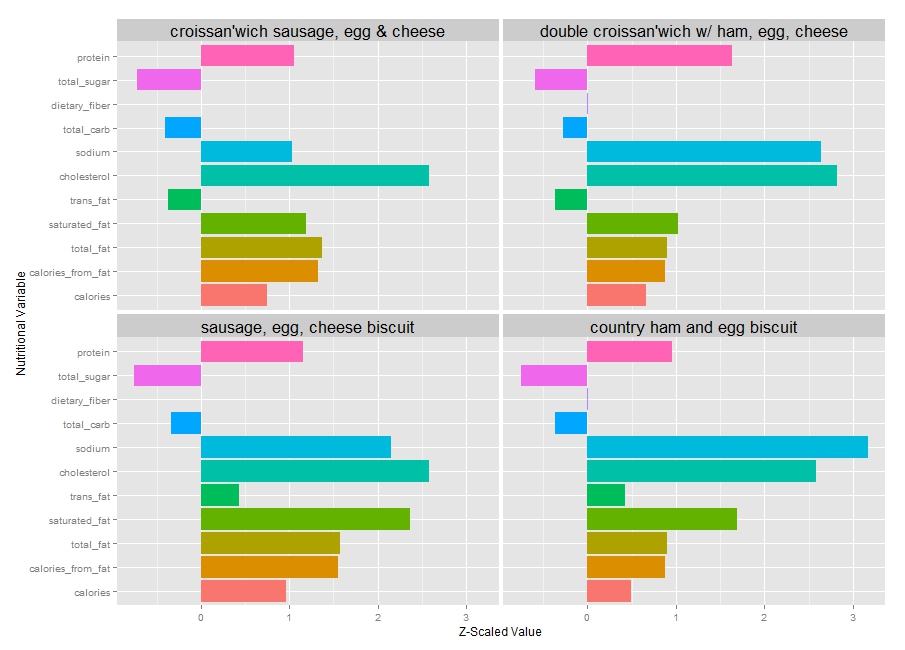
I was going to write part two of the previous post on A/B testing now using Bayesian methods, but I plan to do that in another time since today I'm going to write about clustering, a widely used machine learning technique, specifically clustering Burger King menu items based on their nutritional values. Clustering is an unsupervised learning method to find structure in data; informally, it is a way to find natural groupings among objects of interest. For instance, the graph above is one such cluster formed based on nutritional variables that can be labeled as the breakfast cluster; sausage, egg and cheese biscuit and its variations have high sodium and cholesterol level but low amount of total sugar and carb. I want to cluster Burger King menu as such because I want to see if there are menu items I certainly want to avoid, and I want to find that out without having to manually go through every item and analyze its nutritional values. After all, I am a data scientist, not a nutritionist.
the data
I first downloaded a PDF version of Burger King menu here, then converted it to an Excel file in CSV format to read in RStudio. As you can see in the PDF, each and every menu item is already grouped under its predefined menu category. For example, all the Whopper sandwiches are classified as Whopper Sandwiches and all the kids meal related menu items such as apple slices and kids oatmeal are under the Kids Meals section. But this kind of grouping is really not helpful, especially if you are one of the health-conscious who want to choose a menu that is considerably healthier than the others. It also makes more sense to group apple slices under fruits and oatmeal under breakfast instead of just lumping them all in kids meal. Clustering, or grouping, menu items by nutritional values may reveal a different kind of groups with perhaps new, surprising insights that may be more valuable for the ever growing health-conscious public. Ideally I want the resulting clusters to be clear and robust, and the number of clusters to grow with the size of the data, in this case, the number of menu items.
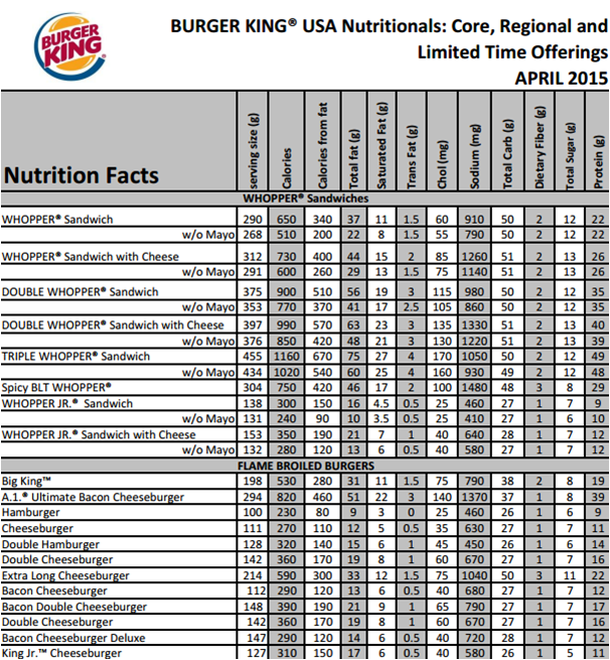
Above is a screenshot of the first page of the downloaded PDF file. All variations of Whopper sandwiches are under the Whopper Sandwiches label and the other burgers are part of the Flame Broiled Burgers group. I did some data cleaning and feature scaling with the scale function in R's base library to arrive at the following data set:
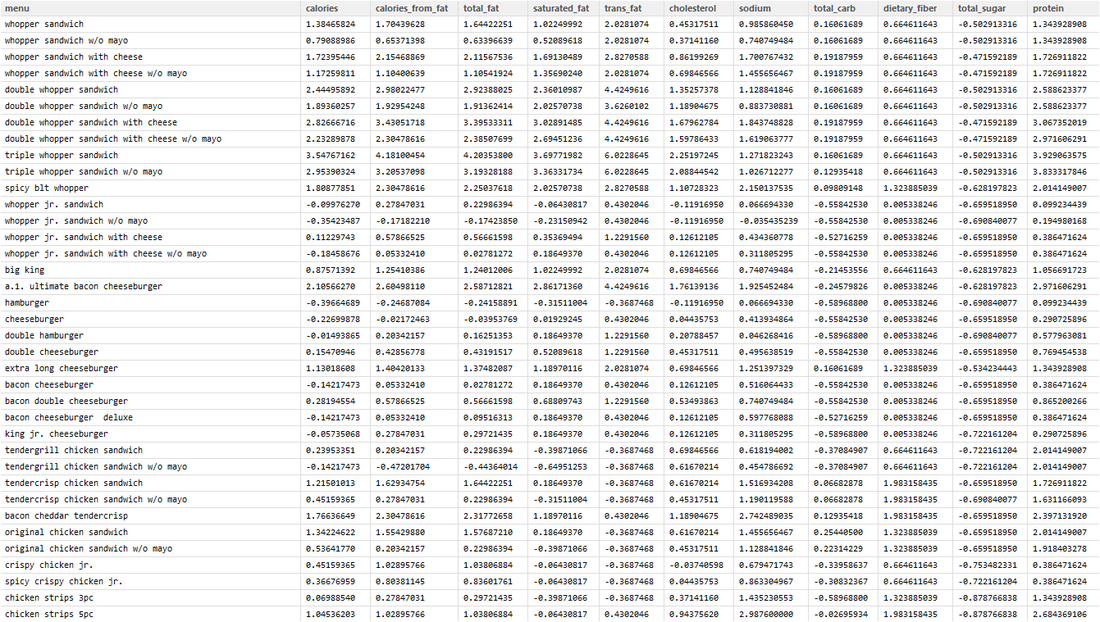
The variables used to cluster Burger King's menu are calories, calories from fat, total fat, saturated fat, trans fat, cholesterol, sodium, total carb, dietary fiber, total sugar, and protein. Unfortunately Burger King doesn't provide vitamin data which may also be useful for better clustering. The clusters are derived from this clean data set.
the methods
There are many ways to cluster data. The traditional approaches like k-means, hierarchical clustering, and Gaussian mixture model-based clustering are not really good options here because I need to specify the number of clusters in advance, counter-intuitive because the objective is to find natural clusters and I want the data to be clustered automatically into its own optimal cluster number. There are ways to select the optimal number of clusters using gap and prediction strength statistics and with NbClust package in R, but the problem is that of a fundamental one: most real-world data don't have a fixed number of clusters. This is also problematic since it makes better sense to have the number of clusters increase as the data size grows, as in this case the number of menu items increases. Moreover, k-means and hierarchical clustering are distance-based algorithms, heuristic methods not firmly supported by probability and statistics, and thus not robust. Gaussian mixture model-based clustering assumes data is generated from a mixture of finite number of normal distributions.
I could try out graph-partitioning approach like spectral clustering or the state-of-the-art community detection method such as Infomap, but the former also has the same problem of fixing the number of graph partitions in a graph where in this case each menu item represents a node with two neighboring nodes connected by an edge indicating a similarity between two menu items. The latter is an algorithm that attempts to find communities within a network of graphs and does not work well in this case because the adjacency matrix created from the scaled data is a network of menu items that are all too closely related, just one big community thus not helpful. It's also sort of a different way to phrase the problem than clustering.
the results
I used Dirichlet process mixture model-based clustering. Understanding Dirichlet process and nonparametric Bayes are quite intuitive if you understand the Chinese restaurant process, Polya urn model, and the stick-breaking process which I'm going to skip here. Assuming that you have a bit of knowledge about Dirichlet process mixture models, the results of my clusters are shown below. I ran Gibbs sampler many times to infer the number of clusters from the entire dataset to be around 7. Let's look at each individual cluster in detail.
cluster 1: breakfast
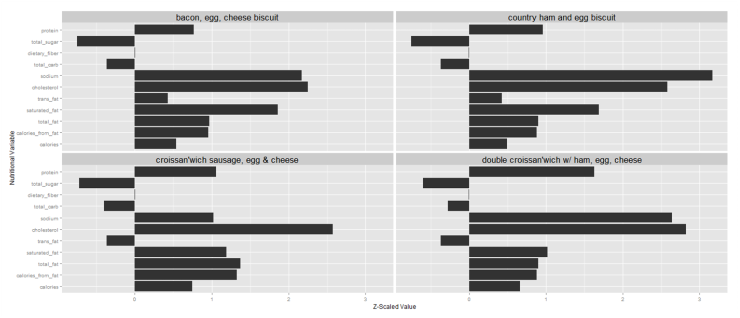
The first cluster is the breakfast cluster with the following representative menu items:
- Sausage, Egg & Cheese Croissan'wich
- Ham, Egg & Cheese Croissan'wich
- Bacon, Egg & Cheese Double Croissan'wich
- Sausage Biscuit
- Country Ham and Egg Biscuit
- Bacon, Egg & Cheese Biscuit
Just by looking at the \(z\)-scaled nutritional values of the four main menu items above, most breakfast menu items contain high sodium and cholesterol which may not be your best option for breakfast.
cluster2: chicken burgers, crispy food
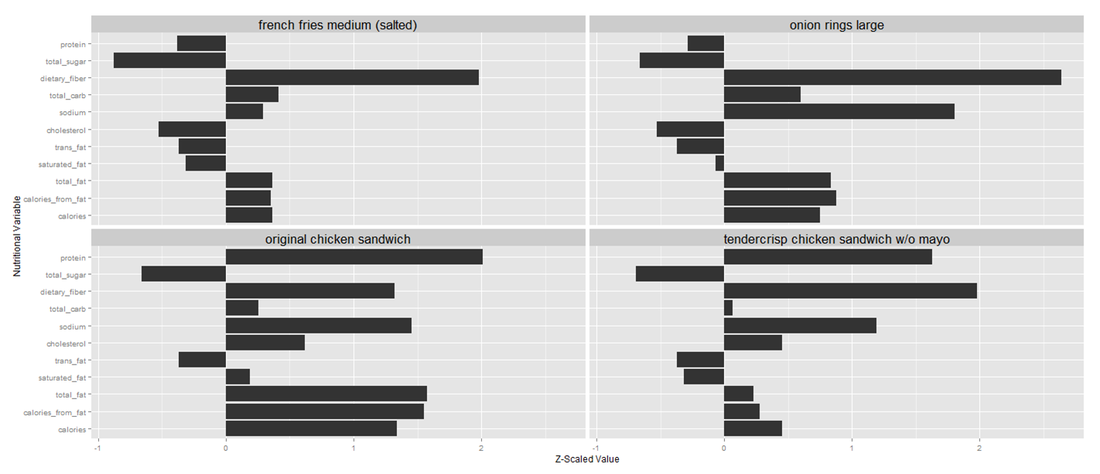
The second cluster is a cluster of mainly chicken burgers and crispy fried food such as french fries, onion rings and hash browns. They have high dietary fiber with low sugar and low trans fat. Chicken burgers such as the Original Chicken Sandwich and Tendercrisp Chicken Sandwich also have a high protein level. I guess this cluster is a bit healthier than the others. It contains the following representative menu items:
- Whopper Sandwich w/o Mayo
- Whopper Jr. Sandwich
- Tendercrisp Chicken Sandwich
- Original Chicken Sandwich
- Spicy Crispy Chicken Jr.
- Big Fish Sandwich
- BK Veggie Burger
- Onion Rings Medium
- French Fries Small
- Hash Browns Large
Note that the clusters are not perfect; some contain menu items that aren't really similar to other items in the same cluster. This problem can be somewhat alleviated if you run clustering algorithms many times and take the average result.
cluster3: big burgers
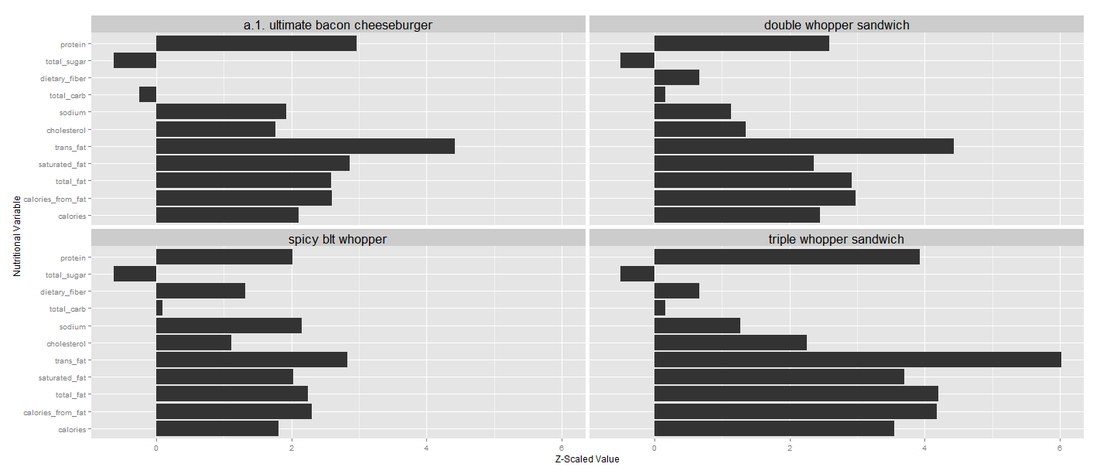
The third cluster mainly contains big burgers, meaning doubles and triples and so-called the ultimate burgers that are high in calories, fat, cholesterol, and protein:
- Whopper Sandwich with Cheese
- Double Whopper Sandwich
- Triple Whopper Sandwich
- Spicy BLT Whopper
- A.1. Ultimate Bacon Cheeseburger
- Chicken Nuggets 20 pieces
As you can see, the shape of the distribution of the nutritional values for all these clusters look similar to each other, meaning the cluster is tight and well-defined.
cluster4: sauces, coffees, less sugary drinks
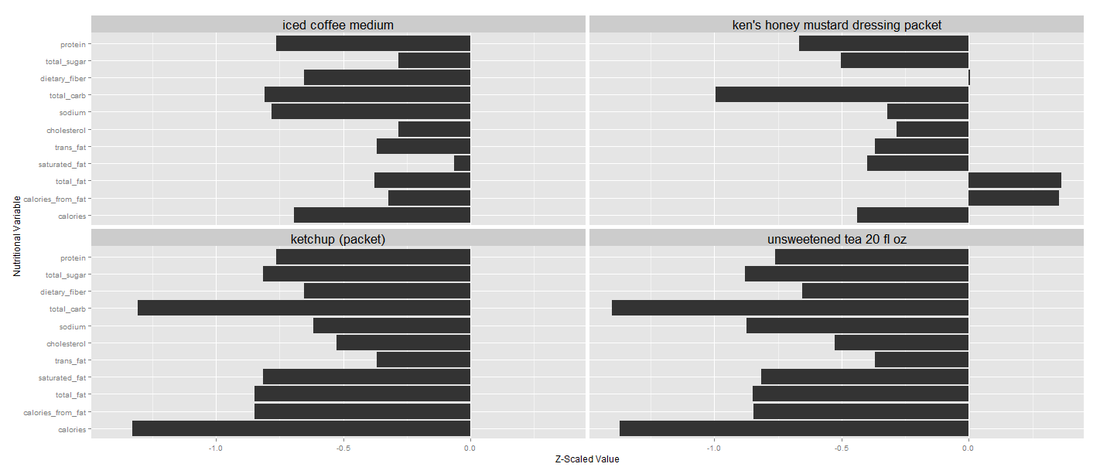
The fourth cluster contains sauces, salad dressings, coffees and less sugary drinks. They have low calories and low carb, but generally not nutritious:
- Ken's Honey Mustard Dressing Packet
- Ken's Citrus Caesar Dressing Packet
- Ketchup
- Mayonnaise
- Seattle's Best Coffee Regular 16 fl oz
- Iced Coffee Medium
- Non Fat Latte Small
- Diet Coke 20 fl oz
- Unsweetened Tea 30 fl oz
- Buffalo Dipping Sauce 1 oz
cluster5: ultimate breakfast platter
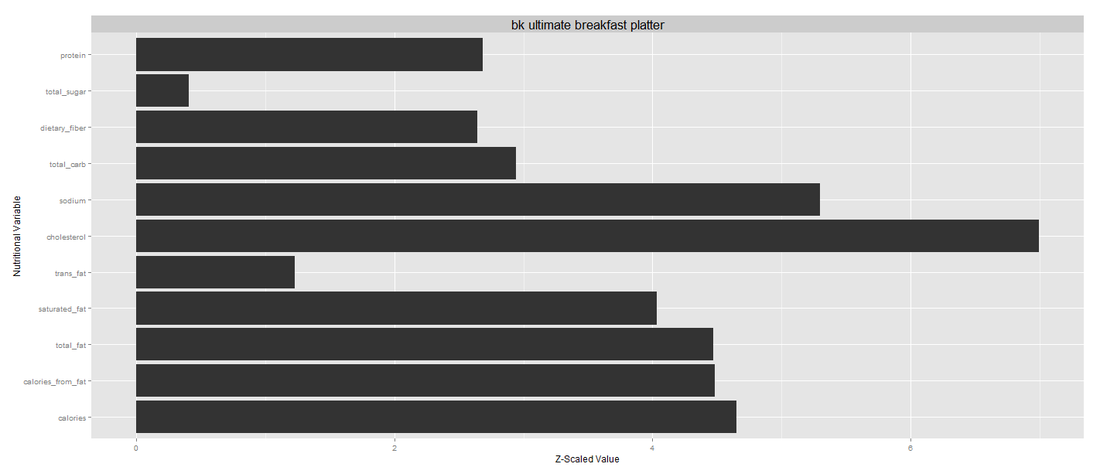
The fifth cluster contains a single menu item - that is, the Ultimate Breakfast Platter. It's similar to the third big burger cluster but also have high sugar level. It's basically high in everything! Yuck! I was pretty surprised by this cluster and concluded that this standalone cluster may be the worst Burger King menu. There is a supporting article here.
cluster 6: desserts and sugary drinks
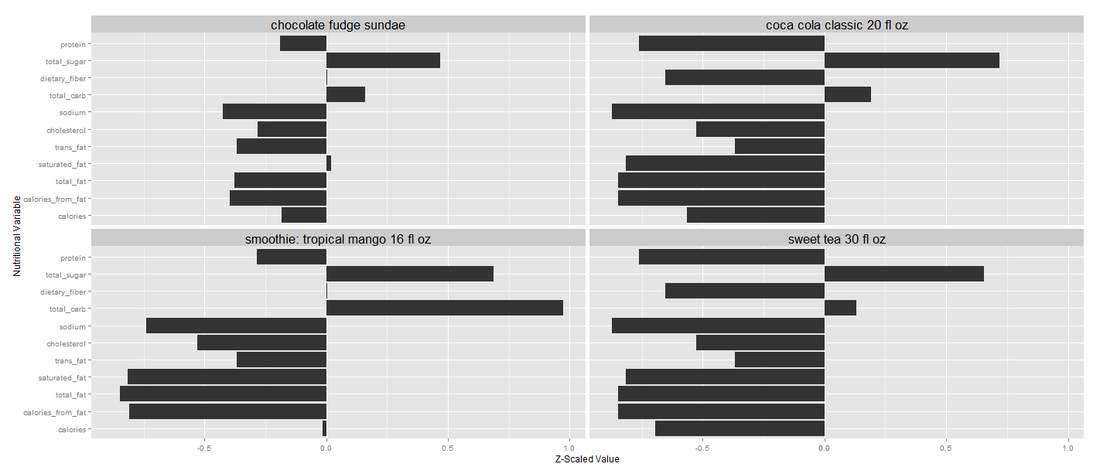
The second to last cluster contains desserts and sugary drinks that are high in, of course, total sugar level and carb. These two are separating difference from the fourth cluster of sauces, coffees and less sugary drinks. If Burger King provided vitamin A and C values for all these menu items, then the clustering algorithm would have created two clusters instead of one, separating sugary drinks high in vitamin C versus desserts that are not.
- Smoothie: Tropical Mango 15 oz
- Smoothie: Strawberry Banana 12 fl oz
- Chocolate Fudge Sundae
- Chocolate Chip Cookies 2
- Dutch Apple Pie
- Hot Chocolate Large
- Sprite 30 fl oz
- Coca Cola Classic 20 fl oz
- Hi-C Fruit Punch 20 fl oz
- Sweet Tea 30 fl oz
- Minute Maid Orange Juice 10 fl oz
cluster 7: milkshakes
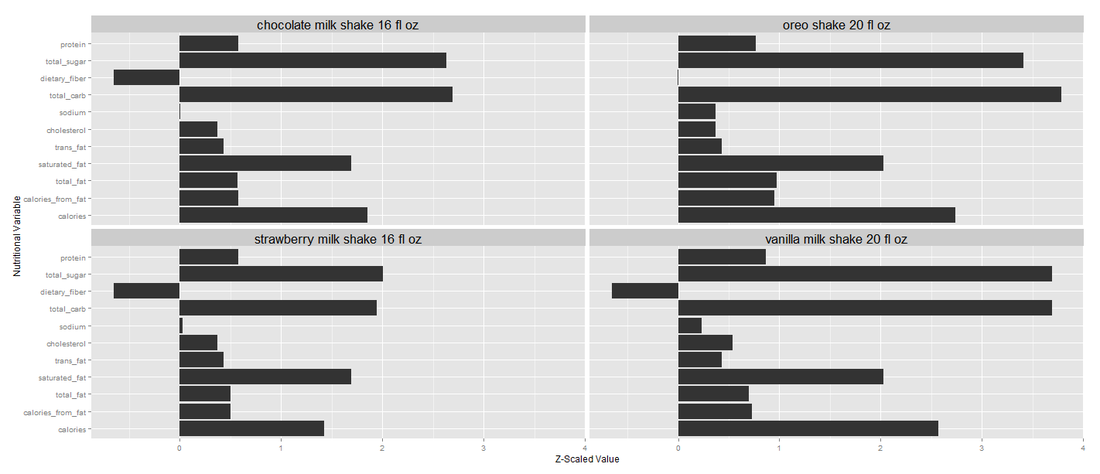
Finally the last cluster is full of milkshakes from vanilla to oreo. As you can see from these 7 quite coherent and robust clusters, we can find out which group of menu items are similar and know to avoid certain items like the Ultimate Breakfast Platter. Now that you have an idea how to cluster Burger King menu items, why not try clustering McDonald's menu and compare the two? That'd be really interesting!